Market Outlook
February 16, 2018
Market Cues
Domestic Indices
Chg (%)
(Pts)
(Close)
Indian markets are likely to open positive tracking global indices and SGX Nifty.
BSE Sensex
0.4
142
34,297
US stocks moved significantly higher over the course of the trading session. With the
Nifty
0.4
45
10,546
upward move on the day, the major averages extended their recent winning streak
Mid Cap
(0.5)
(78)
16,803
to five sessions. The Dow Jones ended up 1.2% to close at 25,200 and the Nasdaq
Small Cap
(1.3)
(235)
18,258
Composite edged advanced to 1.6%, to 7,256.
Bankex
0.4
123
28,732
U.K. shares extended gains with energy and mining stocks climbing, as oil and base
metals prices surged on dollar weakness after the release of mixed economic reports
Global Indices
Chg (%)
(Pts)
(Close)
in the U.S. The FTSE 100 was up by 0.3% to close at 7,235.
Dow Jones
1.2
307
25,200
Nasdaq
1.6
113
7,256
On domestic front, Indian shares opened modestly higher, tracking firm
global markets as investors took in their stride signs of inflation pickup in the U.S.
FTSE
0.3
21
7,235
and the possibility of an interest rate increase at next month's Fed policy meeting.
Nikkei
1.1
235
21,700
The Sensex ended on an upside front of 0.4% at 34,297 while the Nifty ended at
Hang Seng
2.0
600
31,115
10,546 with an upside of 0.4%.
Shanghai Com
0.4
14
3,199
News Analysis
Advances / Declines
BSE
NSE
HSIL- Buy- CMP `433 TP- `510 Upside -18%
Advances
886
483
WPI inflation eases to 2.84 % in January from 3.58% in December 2017
Declines
1,973
1,313
Detailed analysis on Pg2
Unchanged
126
44
Investor’s Ready Reckoner
Volumes (` Cr)
Key Domestic & Global Indicators
BSE
3,995
Stock Watch: Latest investment recommendations on 150+ stocks
Refer Pg5 onwards
NSE
31,825
Top Picks
Net Inflows (` Cr)
Net
Mtd
Ytd
CMP
Target
Upside
Company
Sector
Rating
(`)
(`)
(%)
FII
(599)
(6,445)
6,539
Blue Star
Capital Goods
Buy
743
867
16.7
*MFs
(139)
5,352
14,375
Dewan Housing Finance
Financials
Buy
553
712
28.7
Asian Granito
Other
Buy
534
651
21.9
Top Gainers
Price (`)
Chg (%)
Navkar Corporation
Other
Buy
176
265
50.7
KEI Industries
Capital Goods Accumulate
381
436
14.4
Bomdyeing
281
7.9
More Top Picks on Pg4
Vakrangee
234
5.0
Religare
58
4.9
Key Upcoming Events
Previous
Consensus
Nestleind
7,571
4.3
Date
Region
Event Description
Reading
Expectations
Prestige
325
3.8
Feb16
US
Producer Price Index (mom)
-
Feb16
US
Housing Starts
1,192.00
1,235.00
Top Losers
Price (`)
Chg (%)
Feb20
Euro Zone Euro-Zone Consumer Confidence
1.30
Feb21
Germany PMI Services
57.30
Pnb
128
(12.0)
Feb21
Germany PMI Manufacturing
61.10
Repcohome
558
(7.4)
More Events on Pg7
Maxindia
105
(6.6)
Jetairways
756
(5.9)
Twl
133
(5.8)
As on February 15 2018
Market Outlook
February 16, 2018
News Analysis
HSIL- Buy- CMP `433 TP- `510 Upside -18%
Considering the various initiatives taken by the government like smart cities,
housing for all by 2022, swachh bharat abhiyan and push towards providing
sanitation, would create new demand avenues for sanitaryware segment.
Further, the company has entered into new segment like Consumer segment
(like Kitchen appliances, Water heaters, Air coolers etc.), Pipes and Cap and
closures which drive the further growth for HSIL. We expect HSIL to report net
revenue CAGR of ~12% to ~`2,905cr over FY2017-20E. On bottom-line
front, we expect CAGR of ~15% to `154cr over FY2017-20E owing to better
improvement in operating margin due price hike in container glass segment,
turnaround in consumer business. Further, we believe the de-merger of
consumption business would provide additional upside to investors. Thus, we
initiate coverage on the stock with a Buy recommendation and target price of
`510, indicating an upside of ~27% from the current levels.
Key Finance
Y/E March (`cr)
FY2017
FY2018E
FY2019E
FY2020E
Net Sales
2,078
2,204
2,506
2,905
% chg
5.0
6.0
13.7
15.9
Net Profit
100
81
114
154
% chg
(7.6)
(19.1)
40.5
34.7
OPM (%)
13.8
12.5
13.3
13.9
EPS (`)
13.9
11.2
15.8
21.2
P/E (x)
31.2
38.6
27.5
20.4
P/BV (x)
2.2
2.1
2.0
1.8
RoE (%)
6.9
5.4
7.2
9.0
RoCE (%)
7.4
6.6
8.4
10.1
EV/Sales (x)
1.8
1.7
1.5
1.4
EV/EBITDA (x)
13.2
14.0
11.6
9.8
WPI inflation eases to 2.84 % in January from 3.58% in December
2017
Inflation based on wholesale prices eased to a six-month low of 2.84 per cent in
January on cheaper food articles even as vegetable prices continued to rule high.
Calculated on the basis of Wholesale Price Index (WPI), the inflation was 3.58 per
cent in December 2017 and 4.26 per cent in January 2017.WPI inflation at 2.84
per cent in January is the lowest in six months. The previous low level was
recorded in July at 1.88 per cent. According to report, inflation on food articles
slowed to 3 per cent in January, from 4.72 per cent in December 2017.Inflation in
vegetables witnessed some softening with annual inflation at 40.77 per cent in
January as against 56.46 per cent in the previous month. In its policy review last
week, the RBI had kept key interest rate unchanged and estimated retail inflation to
be
5.1 pc in the January-March quarter. For April-September, RBI
projected inflation to be in the range of 5.1-5.6 per cent.
Market Outlook
February 16, 2018
Economic and Political News
Centre to change base year for GDP, IIP to 2017-18, for CPI it will be 2018
January WPI inflation falls to 6-month low of 2.84%, in line with CPI data
Yogi Adityanath to table UP Budget on Friday; farm, infra bonanza on cards
Centre to procure 32 million tonnes wheat from farmers in 2018-19
January trade deficit widens to $16.30bn; exports rise 9%
Corporate News
US firm ATC moves HC against RCom for Rs 1-bn surety overdue services
Auto component makers gearing up for likely disruption from EV mobility
Amazon beats Microsoft to become world's third-most valuable company
Lamborghini planning to investment in Maharashtra to boost e-vehicle plans
Alcatel launches POP4 10 4G LTE tablet in India priced at Rs 10,999
Market Outlook
February 16, 2018
Top Picks
Market Cap
CMP
Target
Upside
Company
Rationale
(` Cr)
(`)
(`)
(%)
Strong growth in domestic business due to its leade`hip
in acute therapeutic segment. Alkem expects to launch
Alkem Laboratories
25,496
2,132
2,441
14.5
more products in USA, which bodes for its international
business.
Favorable outlook for the AC industry to augur well for
Cooling products business which is out pacing the
Blue Star
7,129
743
867
16.7
market growth. EMPPAC division's profitability to
improve once operating environment turns around.
With a focus on the low and medium income (LMI)
consumer segment, the company has increased its
Dewan Housing Finance
17,347
553
712
28.7
presence in tier-II & III cities where the growth
opportunity is immense.
Loan growth is likely to pick up after a sluggish FY17.
Lower credit cost will help in strong bottom-line growth.
Karur Vysya Bank
8,020
110
160
44.9
Increasing share of CASA will help in NIM
improvement.
High order book execution in EPC segment, rising B2C
KEI Industries
2,986
381
436
14.4
sales and higher exports to boost the revenues and
profitability
Expected to benefit from the lower capex requirement
Music Broadcast
2,089
366
475
29.7
and 15 year long radio broadcast licensing.
Massive capacity expansion along with rail advantage
Navkar Corporation
2,647
176
265
50.7
at ICD as well CFS augur well for the company
Strong brands and distribution network would boost
Siyaram Silk Mills
3,182
679
851
25.3
growth going ahead. Stock currently trades at an
inexpensive valuation.
Market leadership in Hindi news genre and no.
2
viewership ranking in English news genre, exit from the
TV Today Network
2,926
491
560
14.2
radio business, and anticipated growth in ad spends by
corporate to benefit the stock.
After GST, the company is expected to see higher
volumes along with improving product mix. The Gujarat
Maruti Suzuki
2,72,500
9,021
10,619
17.7
plant will also enable higher operating leverage which
will be margin accretive.
We expect loan book to grow at 24.3% over next two
GIC Housing
2,210
410
655
59.6
year; change in borrowing mix will help in NIM
improvement
We expect CPIL to report net Revenue/PAT CAGR of
~17%/16% over FY2017-20E mainly due to healthy
7,245
326
400
22.7
growth in plywood & lamination business, forayed into
Century Plyboards India
MDF & Particle boards on back of strong brand &
distribution network.
We expect sales/PAT to grow at 13.5%/20% over next
LT Foods
3,202
100
128
27.9
two years on the back of strong distribution network &
addition of new products in portfolio.
We expect financialisation of savings and increasing
Aditya Birla Capital
36931
166
230
38.5
penetration in Insurance & Mutual fund would ensure
steady growth.
We expect HSIL to report PAT CAGR of ~15% over
FY2017-20E owing to better improvement in operating
HSIL
2,862
433
510
18.0
margin due price hike in container glass segment,
turnaround in consumer business.
Source: Company, Angel Research
Market Outlook
February 16, 2018
Fundamental Call
Market Cap
CMP
Target
Upside
Company
Rationale
(` Cr)
(`)
(`)
(%)
CCL is likely to maintain the strong growth trajectory
CCL Products
3,787
285
360
26.4
over FY18-20 backed by capacity expansion and new
geographical foray
We forecast Nilkamal to report top-line CAGR of ~9%
to `2,635cr over FY17-20E on the back of healthy
Nilkamal
2,671
1,790
2,178
21.7
demand growth in plastic division. On the bottom-line
front, we estimate ~10% CAGR to `162cr owing to
improvement in volumes.
We expect sales/PAT to grow at 9%/14% over next two
years on the back of healthy demand growth in
Shreyans Industries
227
165
247
50.2
printing. Further, China had banned making paper
from waste pulp which would benefit Indian paper
companies.
The prism has diversified exposure in the different
segment such as Cement, Tile & ready mix concrete.
Prism Cement
6,317
126
160
27.5
Thus we believe, PCL is in the right place to capture
ongoing government spending on affordable housing
and infrastructure projects.
Source: Company, Angel Research
Market Outlook
February 16, 2018
Key Upcoming Events
Global economic events release calendar
Bloomberg Data
Date
Time Country
Event Description
Unit
Period
Last Reported
Estimated
Feb 16, 2018
US
Producer Price Index (mom)
% Change
Jan
-
7:00 PMUS
Housing Starts
Thousands
Jan
1,192.00
1,235.00
Feb 20, 2018
8:30 PMEuro Zone
Euro-Zone Consumer Confidence
Value
Feb A
1.30
Feb 21, 2018
2:00 PMGermany
PMI Services
Value
Feb P
57.30
2:00 PMGermany
PMI Manufacturing
Value
Feb P
61.10
8:30 PMUS
Existing home sales
Million
Jan
5.57
5.60
3:00 PMUK
Jobless claims change
% Change
Jan
8.60
Feb 22, 2018
3:00 PMUK
GDP (YoY)
% Change
4Q P
1.50
Feb 23, 2018
12:30 PMGermany
GDP nsa (YoY)
% Change
4Q F
2.30
3:30 PMEuro Zone
Euro-Zone CPI (YoY)
%
Jan F
1.30
Feb 26, 2018
8:30 PMUS
New home sales
Thousands
Jan
625.00
641.50
Feb 27, 2018
2:25 PMGermany
Unemployment change (000's)
Thousands
Feb
(24.00)
Feb 28, 2018
8:30 PMUS
Consumer Confidence
S.A./ 1985=100
Feb
125.40
124.00
6:30 AMChina
PMI Manufacturing
Value
Feb
51.30
7:00 PMUS
GDP Qoq (Annualised)
% Change
4Q S
2.60
2.60
Mar 01, 2018
3:00 PMUK
PMI Manufacturing
Value
Feb
55.30
Mar 07, 2018
3:30 PMEuro Zone
Euro-Zone GDP s.a. (QoQ)
% Change
4Q F
0.60
Mar 08, 2018
China
Exports YoY%
% Change
Feb
11.10
6:15 PMEuro Zone
ECB announces interest rates
%
Mar 8
-
Mar 09, 2018
3:00 PMUK
Industrial Production (YoY)
% Change
Jan
-
7:00 AMChina
Consumer Price Index (YoY)
% Change
Feb
1.50
7:00 PMUS
Unnemployment rate
%
Feb
4.10
5:30 PMIndia
Industrial Production YoY
% Change
Jan
7.10
Mar 12, 2018
6:00 PMUS
Consumer price index (mom)
% Change
Feb
0.50
Source: Bloomberg, Angel Research
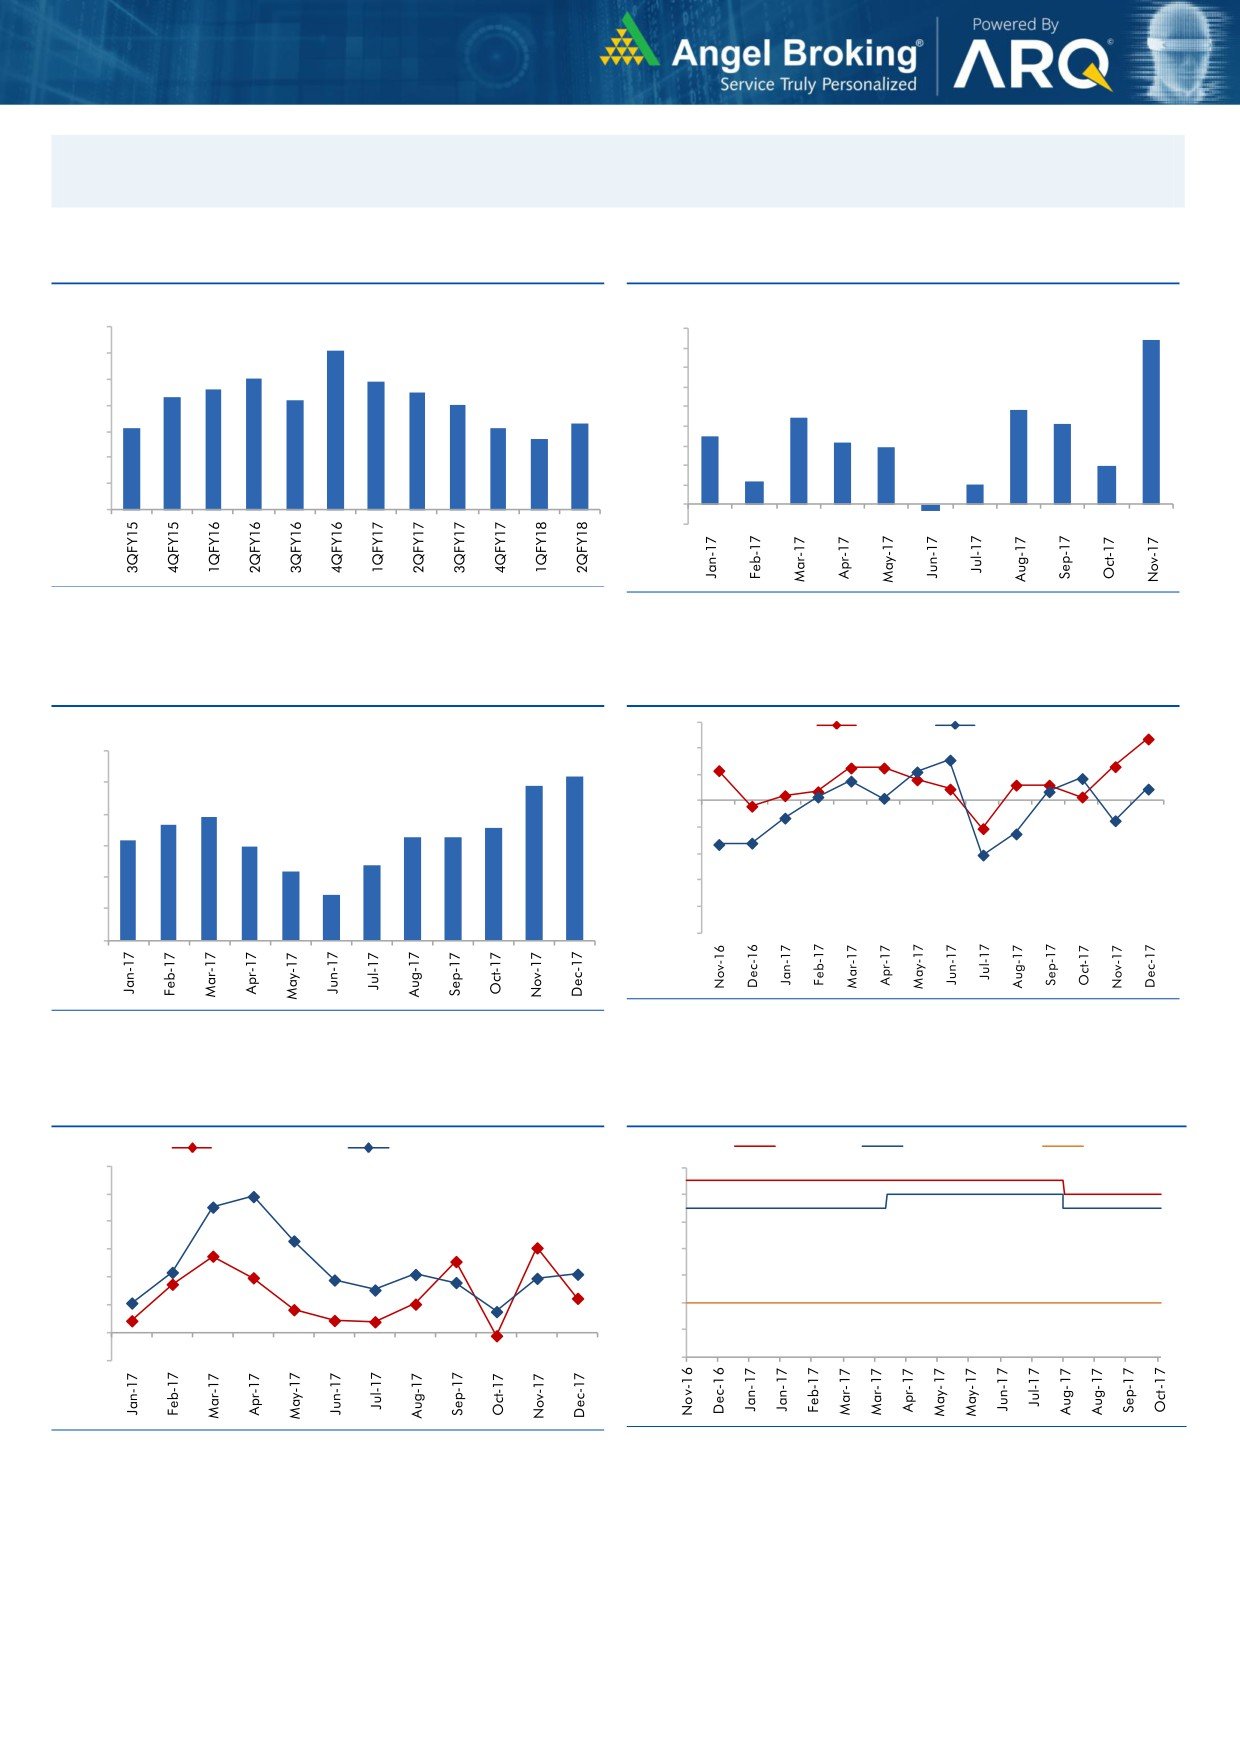
Market Outlook
February 16, 2018
Macro watch
Exhibit 1: Quarterly GDP trends
Exhibit 2: IIP trends
(%)
(%)
10.0
9.0
8.4
9.1
9.0
8.0
8.0
7.9
7.0
7.6
7.5
8.0
7.3
7.2
7.0
6.0
4.8
7.0
6.3
5.0
4.4
4.1
6.1
6.1
5.7
3.5
3.2
6.0
4.0
2.9
3.0
2.0
5.0
2.0
1.2
1.0
4.0
1.0
-
3.0
(1.0)
(0.3)
Source: CSO, Angel Research
Source: MOSPI, Angel Research
Exhibit 3: Monthly CPI inflation trends
Exhibit 4: Manufacturing and services PMI
56.0
Mfg. PMI
Services PMI
(%)
6.0
54.0
5.2
4.9
52.0
5.0
3.9
50.0
3.7
3.6
4.0
3.3
3.3
3.2
3.0
48.0
3.0
2.4
2.2
46.0
2.0
1.5
44.0
1.0
42.0
40.0
-
Source: Market, Angel Research; Note: Level above 50 indicates expansion
Source: MOSPI, Angel Research
Exhibit 5: Exports and imports growth trends
Exhibit 6: Key policy rates
(%)
Exports yoy growth
Imports yoy growth
(%)
Repo rate
Reverse Repo rate
CRR
60.0
6.50
50.0
6.00
40.0
5.50
30.0
5.00
20.0
4.50
10.0
4.00
0.0
3.50
(10.0)
3.00
Source: Bloomberg, Angel Research
Source: RBI, Angel Research
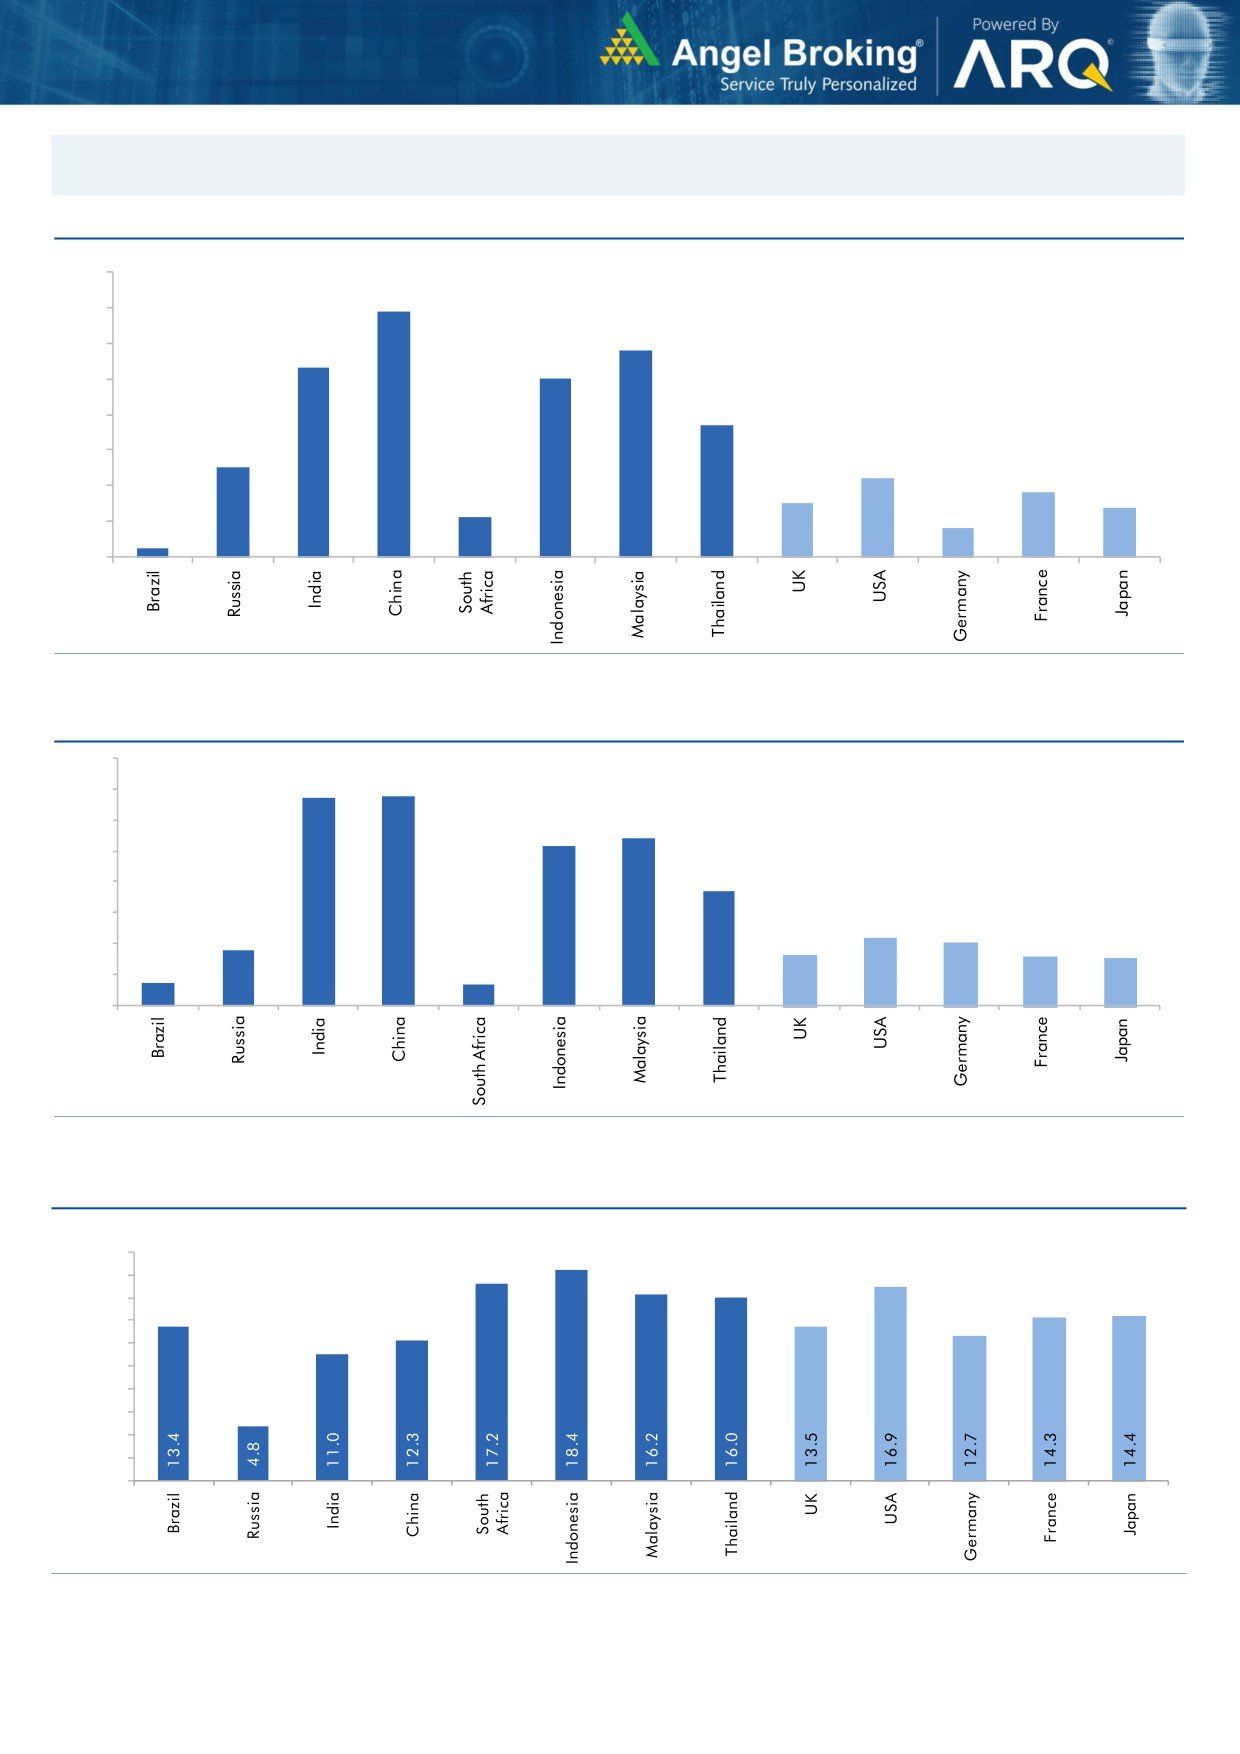
Market Outlook
February 16, 2018
Global watch
Exhibit 1: Latest quarterly GDP Growth (%, yoy) across select developing and developed countries
(%)
8.0
6.9
7.0
5.8
6.0
5.3
5.0
5.0
1.1
3.7
4.0
2.5
3.0
2.2
1.8
2.0
1.5
1.4
0.8
1.0
0.3
-
Source: Bloomberg, Angel Research
Exhibit 2: 2017 GDP Growth projection by IMF (%, yoy) across select developing and developed countries
(%)
6.7
6.8
7.0
6.0
5.4
5.2
5.0
3.7
4.0
3.0
1.8
2.2
2.0
1.7
1.6
2.0
0.7
1.5
0.7
1.0
-
Source: IMF, Angel Research
Exhibit 3: One year forward P-E ratio across select developing and developed countries
(x)
20.0
18.0
16.0
14.0
12.0
10.0
8.0
6.0
4.0
2.0
-
Source: IMF, Angel Research
Market Outlook
February 16, 2018
Exhibit 4: Relative performance of indices across globe
Returns (%)
Country
Name of index
Closing price
1M
3M
1YR
Brazil
Bovespa
84,291
6.2
16.4
31.7
Russia
Micex
2,265
0.3
4.6
6.0
India
Nifty
10,546
(1.3)
3.5
19.9
China
Shanghai Composite
3,199
(6.2)
(6.0)
(0.5)
South Africa
Top 40
52,565
(2.3)
(1.3)
15.7
Mexico
Mexbol
48,808
(1.2)
1.6
3.5
Indonesia
LQ45
1,109
1.4
10.8
25.6
Malaysia
KLCI
1,838
0.9
5.5
8.8
Thailand
SET 50
1,169
(1.5)
9.0
17.9
USA
Dow Jones
25,200
(2.3)
7.5
22.2
UK
FTSE
7,235
(6.7)
(2.4)
(0.9)
Japan
Nikkei
21,465
(9.5)
(6.1)
12.9
Germany
DAX
12,346
(6.8)
(5.3)
5.0
France
CAC
5,223
(5.3)
(1.8)
6.8
Source: Bloomberg, Angel Research p68in4
Market Outlook
February 16, 2018
Research Team Tel: 022 - 39357800
DISCLAIMER
Angel Broking Private Limited (hereinafter referred to as “Angel”) is a registered Member of National Stock Exchange of India
Limited,Bombay Stock Exchange Limited and Metropolitan Stock Exchange Limited. It is also registered as a Depository Participant with
CDSL and Portfolio Manager with SEBI. It also has registration with AMFI as a Mutual Fund Distributor. Angel Broking Private Limited is a
registered entity with SEBI for Research Analyst in terms of SEBI (Research Analyst) Regulations, 2014 vide registration number
INH000000164. Angel or its associates has not been debarred/ suspended by SEBI or any other regulatory authority for accessing
/dealing in securities Market. Angel or its associates/analyst has not received any compensation / managed or
co-managed public offering of securities of the company covered by Analyst during the past twelve months.
This document is solely for the personal information of the recipient, and must not be singularly used as the basis of any investment
decision. Nothing in this document should be construed as investment or financial advice. Each recipient of this document should make
such investigations as they deem necessary to arrive at an independent evaluation of an investment in the securities of the companies
referred to in this document (including the merits and risks involved), and should consult their own advisors to determine the merits and
risks of such an investment.
Reports based on technical and derivative analysis center on studying charts of a stock's price movement, outstanding positions and
trading volume, as opposed to focusing on a company's fundamentals and, as such, may not match with a report on a company's
fundamentals. Investors are advised to refer the Fundamental and Technical Research Reports available on our website to evaluate the
contrary view, if any.
The information in this document has been printed on the basis of publicly available information, internal data and other reliable
sources believed to be true, but we do not represent that it is accurate or complete and it should not be relied on as such, as this
document is for general guidance only. Angel Broking Pvt. Limited or any of its affiliates/ group companies shall not be in any way
responsible for any loss or damage that may arise to any person from any inadvertent error in the information contained in this report.
Angel Broking Pvt. Limited has not independently verified all the information contained within this document. Accordingly, we cannot
testify, nor make any representation or warranty, express or implied, to the accuracy, contents or data contained within this document.
While Angel Broking Pvt. Limited endeavors to update on a reasonable basis the information discussed in this material, there may be
regulatory, compliance, or other reasons that prevent us from doing so.
This document is being supplied to you solely for your information, and its contents, information or data may not be reproduced,
redistributed or passed on, directly or indirectly.
Neither Angel Broking Pvt. Limited, nor its directors, employees or affiliates shall be liable for any loss or damage that may arise from
or in connection with the use of this information.